
 Written by Yanis Kharchafi
Our guide to better understand fund factsheets
The abundance of financial products on the market is only matched by that of the charcuterie products in Migros. There are infinite possibilities!
To help you pick your next investment, a fund is usually complemented by a factsheet – a sheet containing important information.
But just like the list of ingredients on the back of a product, reading a sheet is not always easy.
By the end of this article, you will know how to quickly crack the codes of a factsheet. Which will allow you to determine in no time whether or not a fund suits your financial objectives.
The line-up:
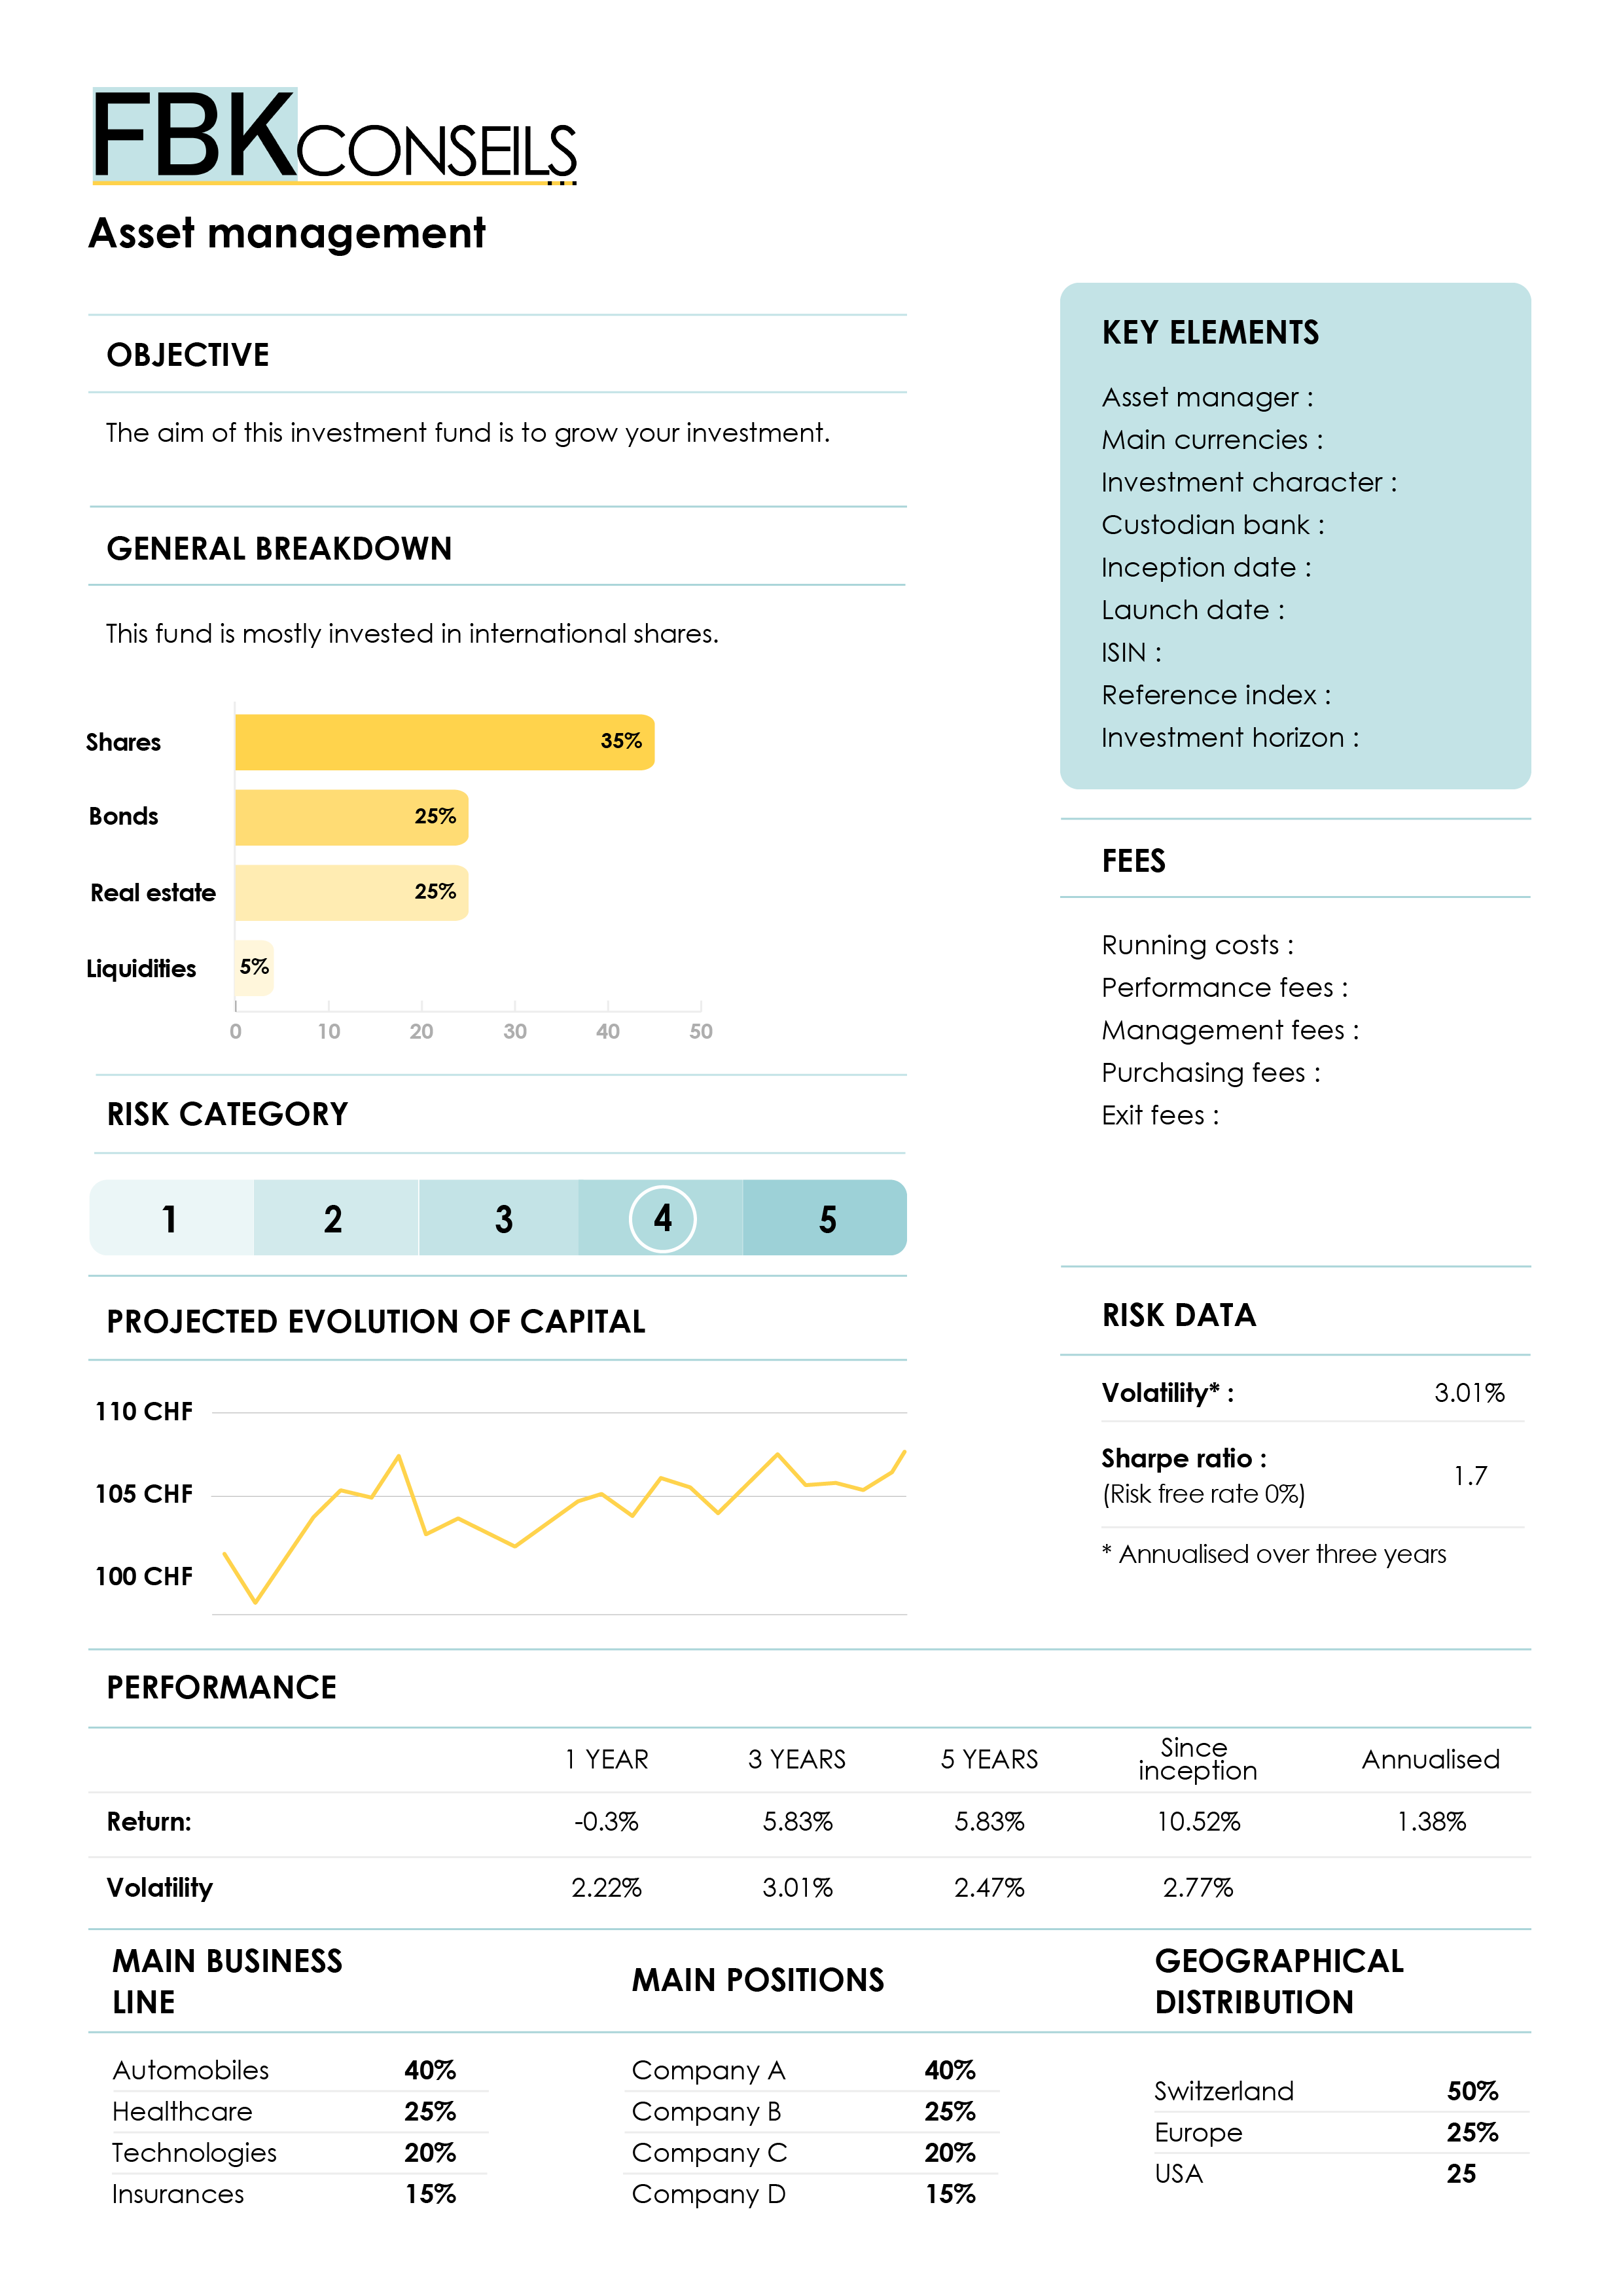
Part 1: Key elements
The first part of the factsheet contains the basic information of the investment fund concerns:
- Asset manager: the person or company managing the product.
- Main currencies: the currency or currencies used by the asset manager to invest.
- Investment character: is your money being managed actively or passively? If the management is passive, then its goal is to replicate the reference index (an average that is compared with the investment’s performance, the same way we used to compare our grades to the class average back when we were pupils). If the management Is active, its goal is to go over this index.
- Custodian bank: some asset managers do not report to a specific bank because they are self-employed, in which case they partner with the banks that receive your funds.
- Inception date: this information can help you understand the product’s longevity better. If it has been around for a while, this probably means that it can be trusted. A young product can be riskier (but also more interesting).
- ISIN – International Securities Identification Numbers: a sequence of letter and numbers that are very useful to identify any fund very easily.
- Investment horizon: minimal investment period, advised by the asset manager, to get the return indicated. The latter is neither constant nor linear but rather the result of an average made of ups and downs. That is why managers consider you need to wait a little while before getting the desired return.
Part 2: The risk category
The risk category is an indicator which, as its name suggests, organises an investment fund’s risk on a scale from 1 to 5 – 5 being the highest risk.
Part 3: The objective and general breakdown of the fund
- The objective is summed up in the form of a short text reiterating the fund’s strategy to deliver the promise made: return first and foremost, careful risk management or else political or ecological responsibility, for instance.
- The fund’s breakdown: how will your asserts be distributed? Which portion will be invested on shares, bonds, real estate, etc?
Part 4: Fees
- Running costs: expressed as a percentage of the invested amount, they cover each year the administrative costs, the audit, the additional expense and sometimes, management fees.
- Management fees: they pay for the work of the managers and their teams.
- Performance fees: these are applicable especially if you are looking to invest your money on high return and high-risk funds. The manager develops more intricate strategies and keeps a close eye on your investments. When he goes above the predetermined objective, he grants himself a significant portion of the surplus.
- Purchasing fee: if they are applicable, they are to be paid only once in order to have access to the product.
- Exits fees: they are fairly rare, they can be asked from you when you recover your assets from the fund. Namely to cover any administrative costs.
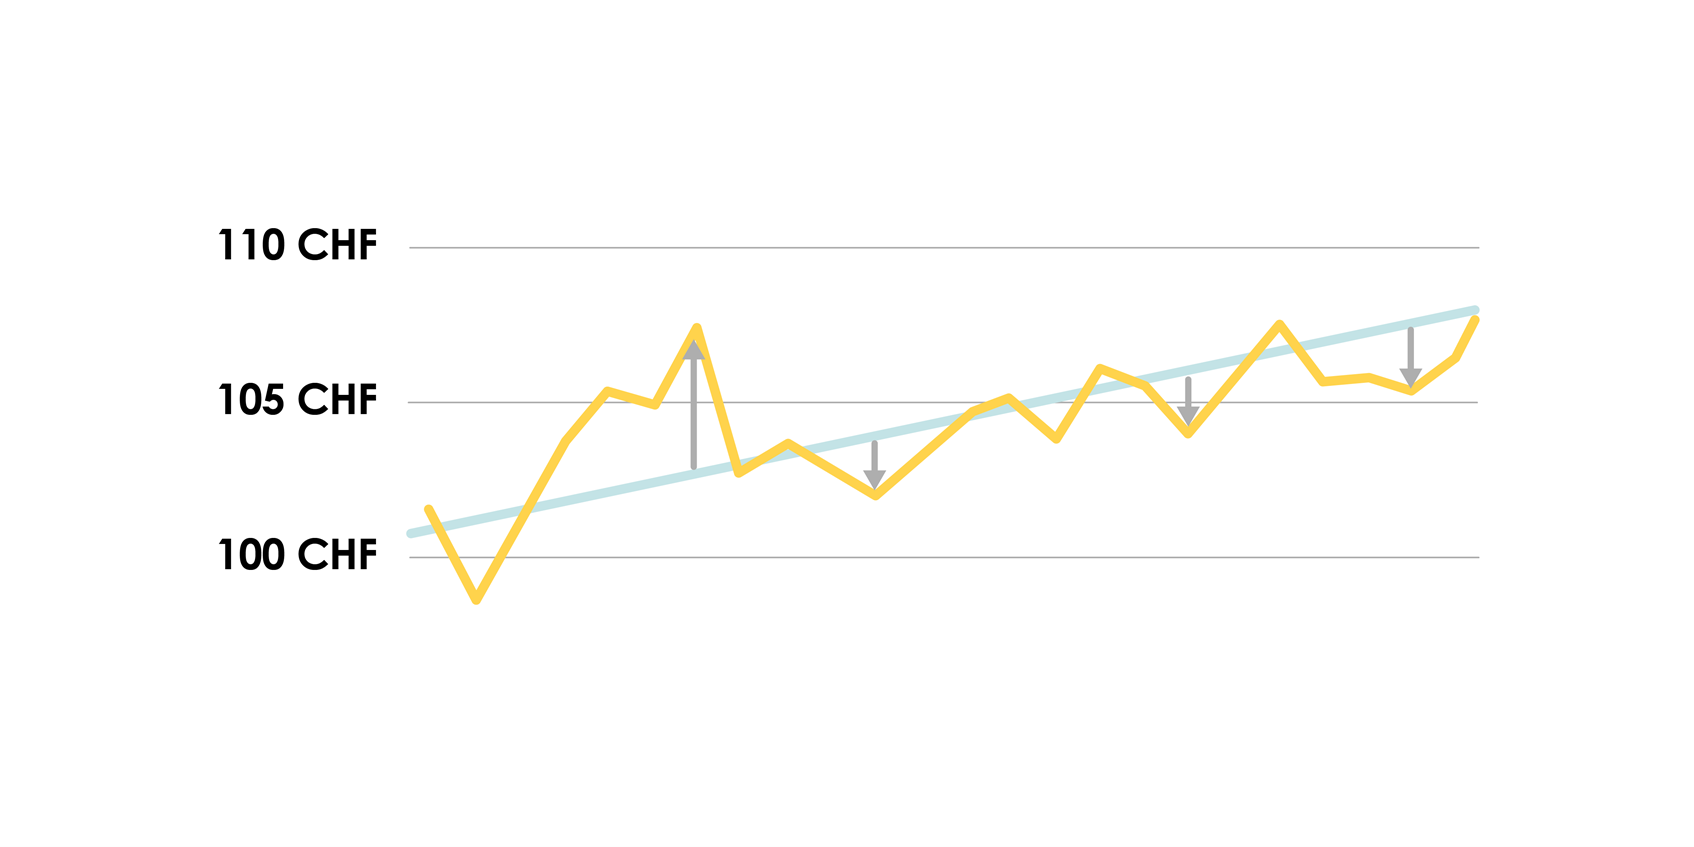
Part 5: The performance graph
Starting at 100, the graph illustrates the returns achieved, thanks to the data of the previous terms.
Of course, previous results are no guarantee about the future. But it is useful to identify general trends.
The table therefore reflects the expected final result, called return, but also the volatility, which accounts for the risk, represented as average deviations.
I can see your head spinning from all this information. Ok, let’s reformulate.
Investment is like a hike. The investment horizon is the trail length, in kilometres. The return, is the overall elevation, meaning the altitude difference between point A and point B. And volatility, is the cumulative elevation gain, or the total of all ascents and descents.
A low risk return is like a false-flat, it rises slowly, without you really realising it.
A high risk return is a rough terrain with steep trails that keep going up and down.
Part 6: The two performance variables
- The return: the most important variable since it measures your gains (or your losses in case of negative returns).
A good return is not only the result of the work quality of the asset manager and its team, but also that of the assets that form your fund. This is why it is important to understand your factsheet very well.
If you are looking for a high return, reach out to the best asset manager in your region but place your money only on funds made of bonds, you will be disappointed with the results.
Imagine you use the services of a qualified manager and invest on the right fund. To calculate your final return, you need to distinguish two types of returns.
Just like for income, we differentiate between…
- The GROSS return: the total gain, without taking into account the various fees.
- The NET return: the actual gain, which represents the gain minus the fees.
When speaking of return from your investment funds, always make sure it is the net return that is being referred to.
In fact, why consider the risk when all that really counts is the return?
Simply because it is harder to project yourself in the future when the invested amount is constantly varying, like the graph above.
Imagine needing this amount at a time when the fund is at a loss… You will only be able to get part of your invested money back.
It may also be that it grew massively, as if it was under steroids!
The more a fund is volatile, the more it represents uncertainty for its investor.
Furthermore, sometimes, two funds with opposite risk profiles may have the same return. In one case, it is a peaceful journey. In the other, it is a jungle. But the destination is the same.
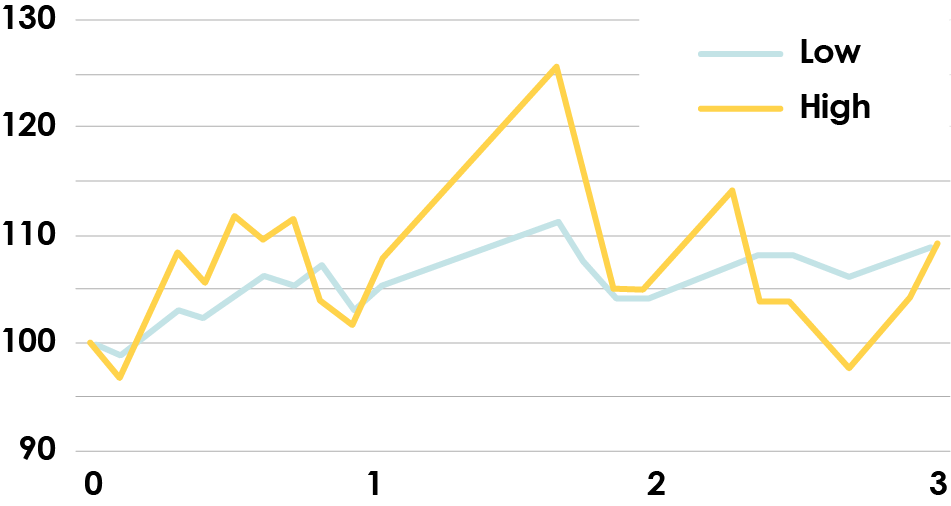
Both funds above are similar when it comes to return (9% over 3 years) but one of them is a lot more risky.
Part 7: Data about risk
A wise investor would say: big risk, small profit -> beware…
Small risk, big profit -> go for it!
And you, what kind of investor are you?
But you still need to measure the risk precisely. Volatility is an abstract number describing an abstract mechanism, that of investment.
When speaking of elevation, we know what to expect because it is physical. And even then, it is not always easy.
But in the case of investment, unless you have been around for a few decades already, it is an impossible mission.
Is volatility a good thing? And what about 3%? From what percentage should you give up?
This is exactly the problem that the Sharpe ratio helps solving – a formula which compares the return with the risk.
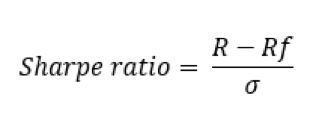
R: annualised return over a given period.
Rf: risk free return, it is the return we get without even investing one’s money.
σ : volatility over the same period of time
No need to sign up for math classes again in order to be successful at investing, all you need to know I how to interpret the result.
- The ratio is above 1: the return is higher than the volatility. Which means that the fund was able to generate a return that is higher than the risk previously taken. Which is a good sign.
- The ratio is between 0 and 1: the return is lower than the volatility, which means that the fund does generate a positive return, but at the price of a significant risks. Buckle up, the investment might be taking you on a rollercoaster.
- The ratio is below 0: the return is negative… run as fast as you can!
Let us specify one last time that this is not the Nostradamus ratio but rather the Sharpe ratio, invested by an American economist called William F. Sharpe.
Though he did get a Nobel prize, he has yet to be able to guess the future. His formula allows to analyse the past in order to predict the future… that is if the future acts like the past. But, this is precisely our point: nothing can guarantee this.
Part 8: The detailed composition of the fund
Finally, we are finishing with the easiest part: that of the fund’s composition in the affected industries, companies and of their geographical position.
The cheatsheet of the factsheet
Phew, it is over. We have seen a few tongue twisters but we clearly defined them and made sure to stay away from any technical terminology.
With this article, my aim was to create the most comprehensive cheatsheet about the factsheet there is out there. Add this page to your favourites and come back to it in one click each time you need to interpret a factsheet.
Doing it is very easy: click on the little star on the right of your URL bar.
Any questions left? Send us a message, we would be happy to answer them.
Finally, if you want to speed your results up a bit or simply be accompanied on a short, mid or long term, get in touch with us and we will set up a first commitment-free appointment.
Nowadays, it is possible to invest on your own, as long as you have an internet connexion and a smartphone. But the learning time is long a full of pitfalls. Each mistake costs you money and most of them will be avoided by going through a team of professionals.